- 1. What a candlestick chart shows
- 2. Understanding the anatomy of a candle
- 3. Choosing the right time frame
- 4. Step-by-step method to read a candlestick
- 5. Key single-candle signals
- 6. Important multi-candle patterns
- 7. Using candlesticks with support and resistance
- 8. Context matters
- 9. Volume as confirmation
- 10. Multiple time frame analysis
- 11. Common mistakes and how to avoid them
- 12. Practical step-by-step walkthrough
- 13. Pinpointing entries and exits with candlesticks
- 14. Combining candlesticks with indicators
- 15. Building a routine for reading candlestick charts
- 16. Case studies: how signals behave in different phases
- 17. Risk management aligned with candlestick reading
- 18. Actionable checklist you can use today
- 19. Putting it all together
Candlestick charts are one of the clearest ways to see how price moves over time. They show where buyers and sellers took control, how momentum shifted, and whether a market might continue in the same direction or reverse. If you are new to trading or you want a solid refresher, this step-by-step guide will help you read candlestick charts confidently and use them in a practical way.
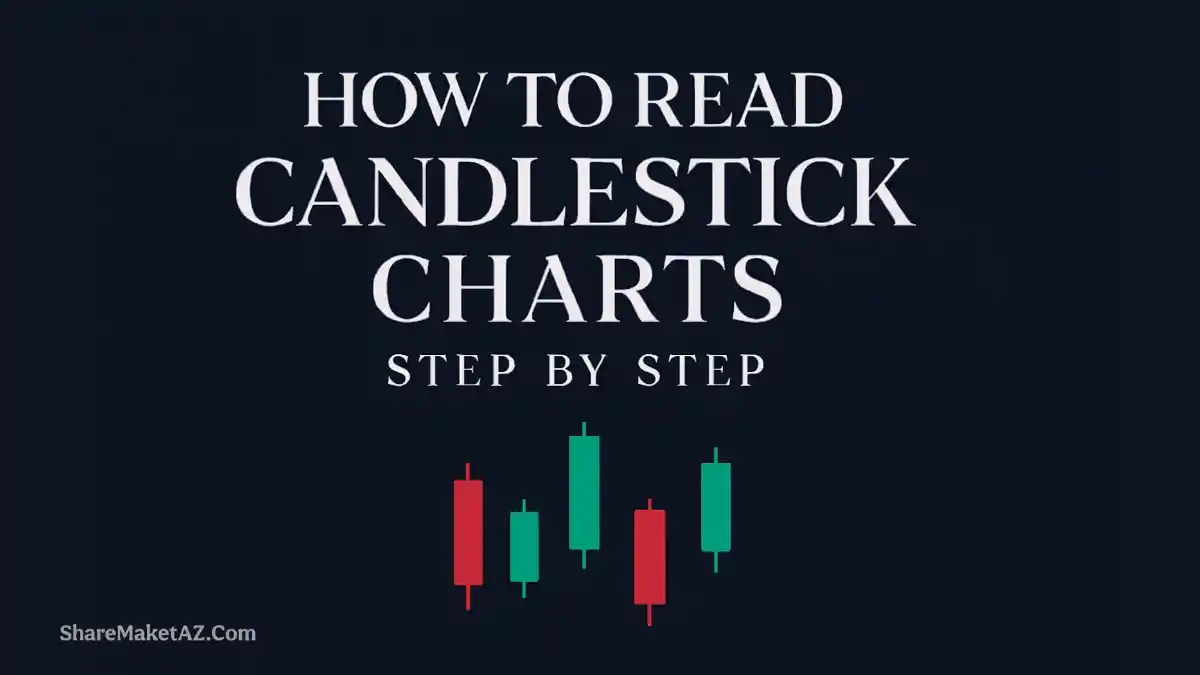
What a candlestick chart shows
A candlestick chart tracks price movements within a chosen time period. Each candlestick captures four key prices: open, close, high, and low. This structure gives more detail than a simple line chart and helps you see the battle between buyers and sellers as it happened within that period.
Most charting platforms show bullish candles (close above open) in green and bearish candles (close below open) in red. The colors make it easy to spot runs of buying or selling, clusters of indecision, and areas where price tested levels and pulled back.
Understanding the anatomy of a candle
Every candlestick has a body and may have upper and lower wicks, also called shadows. The body shows the distance between the open and close. The wicks show how far price traveled beyond the body during that period.
- Open: The first traded price in the chosen time period.
- Close: The last traded price in that period.
- High: The highest price reached.
- Low: The lowest price reached.
- Body: The rectangle between open and close. A large body signals strong momentum.
- Wicks: The thin lines above and below the body. Long wicks show rejection or volatility.
When the close is above the open, the candle is bullish. When the close is below the open, the candle is bearish. The size of the body and the length of the wicks tell you how decisive that period was. A big body with short wicks reflects a strong move. A small body with long wicks reflects back-and-forth trading and indecision.
Choosing the right time frame
The time frame you select changes how you read the chart. A one-minute candle can be noisy and fast. A daily candle smooths out that noise and shows the larger picture. Day traders often focus on one-minute, five-minute, or fifteen-minute charts. Swing traders tend to use one-hour to daily charts. Long-term investors typically prefer daily and weekly charts.
Pick a time frame based on your goals, the speed of your decisions, and how much time you can watch the market. Longer time frames usually give cleaner signals. Shorter time frames require discipline because there is more noise and more false signals.
Step-by-step method to read a candlestick
Use a simple checklist to read each candle and build context. This will keep your analysis consistent and reduce guesswork.
- Check the trend: Is price generally moving up, down, or sideways? Signals mean more when they align with the trend.
- Note the color: Bullish candles suggest buyers were stronger. Bearish candles suggest sellers were stronger. A mix of both often shows a range.
- Compare body size: Large bodies mean strong momentum. Small bodies signal hesitation, balance, or a pause.
- Read the wicks: A long upper wick shows selling pushed price down after buyers tried to break higher. A long lower wick shows buying stepped in after sellers tried to push lower.
- Locate the candle: Where did it form relative to support, resistance, or trend lines? Position adds meaning.
- Check volume if available: A pattern with strong volume is more likely to be reliable than one with light volume.
Key single-candle signals
Some single candles carry strong messages, especially when formed at meaningful levels and confirmed by the next candles.
- Doji: Open and close are very close. It reflects indecision. On its own, a doji is neutral, but near strong levels it can warn of a possible shift.
- Hammer: Small body near the top with a long lower wick. Often appears after a decline and can signal a potential bullish reversal if confirmed.
- Inverted hammer: Small body near the bottom with a long upper wick. After a decline, it can hint at a potential reversal if the next candle closes higher.
- Shooting star: Small body near the bottom with a long upper wick after a rise. It can signal a possible bearish reversal if confirmed.
- Marubozu: Candle with little to no wicks. It shows strong conviction. A bullish marubozu indicates steady buying. A bearish marubozu indicates steady selling.
Treat single-candle signals as clues, not certainties. Confirmation by the next candles or by volume makes them more dependable.
Important multi-candle patterns
Two- and three-candle patterns add context and can hint at possible reversals or continuation. The best patterns appear near key levels and within a clear trend structure.
- Bullish engulfing: A small bearish candle followed by a larger bullish candle that fully covers the prior body. It signals buyers overcame sellers. Stronger near support.
- Bearish engulfing: A small bullish candle followed by a larger bearish candle that fully covers the prior body. It signals sellers took control. Stronger near resistance.
- Morning star: A bearish candle, then a small indecision candle, then a bullish candle closing into the first candle’s body. Suggests a bullish reversal.
- Evening star: A bullish candle, then a small indecision candle, then a bearish candle closing into the first candle’s body. Suggests a bearish reversal.
- Harami (bullish or bearish): A small candle within the previous candle’s body. It hints at a potential pause or shift. Confirmation is important.
- Tweezer tops and bottoms: Two consecutive highs or lows at similar levels. They show price rejection and can mark turning points.
Patterns gain reliability when they form where it makes sense. For example, a bearish engulfing at a clear resistance level is more meaningful than the same pattern in the middle of a range.
Using candlesticks with support and resistance
Support and resistance are price areas where the market has reacted before. When candlestick signals appear at these levels, they carry more weight. Think of these areas as zones, not exact lines, since price often overshoots and snaps back.
- Support: A floor where buying often appears. A bullish signal at support can set up a bounce.
- Resistance: A ceiling where selling often appears. A bearish signal at resistance can set up a pullback.
- Breakouts: If a strong candle closes beyond support or resistance with momentum and volume, it can start a new leg.
- Retests: After breaking a level, price often returns to it. A strong rejection on the retest can confirm the breakout.
Mark recent swing highs and lows, areas with multiple touches, and zones with strong reversals. Then watch how candles behave as price approaches and reacts to those levels.

Context matters
Candlesticks don’t exist in a vacuum. Patterns can appear everywhere, but not all of them are useful. Context helps filter signals and improve decision quality. Look beyond the candle and consider what the market is doing in general.
- Trend direction: Signals in line with the trend have a higher chance of working. Countertrend signals need strong evidence.
- Market phase: Trending markets behave differently from ranging ones. In ranges, reversal signals near boundaries often work better.
- Volatility: Wide swings produce larger candles and more noise. Adjust your expectations and risk controls accordingly.
- Session timing: In some markets, open and close times affect volume and behavior. Signals near the close can carry more conviction.
When you add context to each candle and pattern, you make fewer mistakes and avoid chasing every signal you see.
Volume as confirmation
Volume shows how active the market was during a move. A strong pattern supported by higher volume suggests genuine interest. A strong-looking candle with weak volume can be a trap. Not all markets have reliable volume, but where available, it is a helpful filter.
- Breakouts: Look for rising volume on breakouts. It suggests that more participants support the move.
- Failed moves: A breakout without volume often fails. Watch for quick reversals back into the range.
- Reversals: A reversal signal near a key level with strong volume is more credible than one with light activity.
Use volume to separate strong signals from weak ones. It won’t guarantee outcomes, but it improves odds by filtering low-quality setups.
Multiple time frame analysis
Reading the same market on different time frames can improve your understanding and timing. A setup that aligns across time frames is often stronger than one that only appears on a single chart.
- Top-down approach: Start with the higher time frame to find the main trend and key levels. Then move down to lower time frames to find entries.
- Alignment: A bullish daily structure paired with a bullish pattern on the one-hour chart gives a cleaner setup.
- Timing: Use lower time frames to fine-tune entries near higher time frame levels to reduce risk.
This approach adds structure to your workflow and reduces noise. You trade in the direction of the bigger picture while timing entries with more precision.
Common mistakes and how to avoid them
Even with a solid method, it is easy to misread candlesticks or jump into trades too quickly. Here are common pitfalls and practical ways to avoid them.
- Using patterns in isolation: Don’t act on a pattern without context. Confirm with trend, levels, and volume where possible.
- Overfitting signals: Seeing patterns everywhere leads to overtrading. Set clear rules for what qualifies as a setup.
- Ignoring risk management: Even strong signals can fail. Use stops, position sizing, and a plan for exits.
- Chasing breakouts: If you miss the first move, wait for a retest or a fresh signal. Don’t chase late entries.
- Skipping confirmation: Many reversal signals need confirmation by the next candle or by a break of a minor level.
Make a checklist, track your trades, and review outcomes. This tightens your process and helps you avoid repeating errors.
Practical step-by-step walkthrough
Let’s walk through an example to see how these ideas fit together. Imagine a stock has been in a decline for several days, making lower highs and lower lows. Price approaches a prior support zone where buyers stepped in before.
On the daily chart, a hammer forms right at that support with a long lower wick and a small body near the top. This shows that sellers pushed price down, but buyers brought it back near the open by the close. The next day, a bullish engulfing candle appears, closing above the hammer’s body. Volume is higher than average on both days.
On the one-hour chart, you mark the support zone and spot a pullback into that zone after the break higher. A smaller bullish candle rejects the level with a brief lower wick. You enter a long trade near the retest with a stop just below the zone and aim for the recent swing high.
This step-by-step approach stacks the odds in your favor: a clear level, a reversal signal, confirmation, volume support, and alignment across time frames. It won’t guarantee success, but it reduces guesswork and adds discipline to your process.
Read also: How to Start Day Trading for Beginners: A Complete Guide
Pinpointing entries and exits with candlesticks
Entries and exits feel more objective when you tie them to levels and candle behavior. Here are simple rules that many traders use to keep decisions clean.

- Entry: Enter on confirmation of the signal at or near a key level. Use the next candle close, a break of a minor high or low, or a retest as your trigger.
- Stop-loss: Place stops beyond the wick or beyond the level the signal is based on. This gives the trade room to breathe while limiting risk.
- Targets: Aim for the next logical level. Use prior swing highs or lows, mid-range levels, or measured moves.
- Partial profits: Consider taking partial profits at the first target and trail the rest. This balances risk and reward.
Keep your rules simple. The goal is to remove emotion and make it easier to follow your plan even when the market moves fast.
Combining candlesticks with indicators
Indicators can help you filter signals and add structure to your analysis. Use them as support tools, not as the sole reason to trade. Two or three well-chosen indicators are enough for most workflows.
- Moving averages: Show trend direction and dynamic support or resistance. A bullish signal above rising averages is stronger than the same signal below falling averages.
- RSI: Highlights momentum and potential overbought or oversold conditions. A bullish signal near oversold in an uptrend can be powerful.
- MACD: Shows shifts in momentum. Crosses or divergences can confirm what you see in the candles.
Keep your chart clean. The more cluttered it is, the harder it becomes to read price action. Candles tell the story. Indicators should support that story, not replace it.
Building a routine for reading candlestick charts
A consistent routine keeps your analysis steady and reduces day-to-day noise. With practice, you will read candles faster and spot high-quality setups more easily.
- Scan higher time frames first: Identify trend and key zones. This sets the backdrop for your decisions.
- Mark levels: Draw support, resistance, and trend lines that matter. Ignore minor levels that clutter the chart.
- Watch how candles interact with levels: Look for rejection, absorption, or clean breaks. The wicks and closes reveal intent.
- Wait for confirmation: Let the next candle confirm the signal before you enter. Patience improves quality.
- Record and review: Keep a log with screenshots. Review weekly to refine what works for you.
This routine turns reading candlesticks into a process rather than a guess. Over time, your eye will pick up recurring behaviors and improve your timing.
Case studies: how signals behave in different phases
Trending markets
In a strong uptrend, pullbacks are often shallow. Bullish signals near rising moving averages tend to work better than reversal signals against the trend. A bullish engulfing after a modest dip can restart the move.
Ranging markets
In a range, price bounces between support and resistance. Reversal signals near the edges become more reliable. Look for hammers at support and shooting stars at resistance, then aim for the opposite boundary.
Breakout environments
Breakouts occur when price closes cleanly beyond a well-tested level. Strong candles with little wick and higher volume show conviction. After the breakout, a retest offers a second chance with a clear stop.
High-volatility swings
In volatile phases, candles are larger and whipsaws are common. Use wider stops and smaller positions. Focus on the most obvious levels and wait for clear rejection or confirmation candles to reduce false starts.
Risk management aligned with candlestick reading
Candlesticks help with entries, but risk management determines outcomes over time. Tie your risk rules to the candles and levels you use, so they stay logical and easy to follow.
- Define risk per trade: Decide a fixed percentage or amount to risk on each trade. Keep it small enough to survive a series of losses.
- Place stops at sensible points: Beyond a wick or beyond a level that would invalidate the setup. Avoid arbitrary distances.
- Position sizing: Calculate size based on stop distance and your risk per trade. This keeps risk consistent.
- Reduce exposure in noisy conditions: Trade smaller or sit out when signals are unclear.
Good risk habits let you stay in the game and benefit when your method aligns with market conditions. Without them, even solid signals won’t help much.
Actionable checklist you can use today
- Identify trend: Up, down, or sideways across higher time frames.
- Mark key levels: Support, resistance, swing highs and lows.
- Watch how candles form at levels: Look for rejections, engulfing patterns, or strong closes.
- Wait for confirmation: Enter on the next candle close or break of a minor level.
- Manage risk: Place stops beyond wicks or levels and size positions correctly.
- Review and iterate: Log setups, take screenshots, and refine your rules weekly.
Tip: If you find yourself forcing trades, step back and wait for candles to form at well-defined levels. Quality beats quantity.
Putting it all together
Reading candlestick charts is about understanding price behavior in context. You start with trend and levels, then let candles reveal how buyers and sellers respond. Single candles give fast clues. Multi-candle patterns add depth. Volume and time frames help filter signals and sharpen entries.
Keep your process simple and repeatable. Focus on high-quality signals near clear levels. Confirm before you act. Protect your capital with steady risk rules. Track results and refine. With time and patience, candlestick reading becomes a skill you can trust and a core part of your trading decisions.
Disclaimer: This content is for educational purposes only and does not constitute financial advice. Trading involves risk, and readers should conduct their own research or consult a licensed advisor before making investment decisions.